In my last article I’ve written about how to find out if a business is scalable by examining the economics of the sales unit, i.e. cost & revenue. From the examples demonstrated, we’ve learned that the revenue performance are entirely dependent on the acquisition type of the business, and to recap:
- For customer-centric businesses that acquire customers, the revenue performance will be determined by 4 variables, i.e. average customer churn rate, average transaction frequency, order value, & margin %.
- For transaction-centric businesses that acquire transactions, the revenue performance will be determined by only 2 variables, i.e. average order value & margin %.
Nonetheless, regardless whether the business is customer-centric or transaction-centric, the cost performance are both determined by the same variables, i.e. total cost to win acquisition & total acquisition. Which brings me to my next point that I’m dedicating this article to deliberate on customers acquisition, specifically in a context of us living in the information age where consumers are constantly experiencing information overload – how would we know what drives the acquisition along the customer journey? And how do we make sure we are investing the customers acquisition cost in the most objective manner?
Identify your online acquisition funnel stages
The reality about the customer acquisition funnel is that the drop-off does not just happen in one occurrence, but rather in a cascading manner throughout the timeline of a funnel journey. Hence, to strategically minimize dropping-offs throughout the funnel we should identify which are the stages that are prone to encounter drop-offs along the funnel, and minimize the drop-off rate for each of the stages. In other words, instead of only assigning one goal for the entire customer acquisition funnel, it is rather strategic to break it down into individual goals for each stage where the drop-offs are prone to happen, to have better insights and conclusive plans to improve your entire customer acquisition funnel performance.
Let’s take online store customer acquisition funnel as an example, throughout the online shopping journey if there were 100 users visited your product page and ended up with 20 successful transaction, it would be too generalized to conclude that the product is the reason that resulted in 20% conversion rate; or it would be too generalized to conclude that the product page is misleading that causing the drop-off; or its also generalized to say both the product & product page are not the culprit, instead the initial ads content is the reason that resulted in 20% conversion rate. One way or another, without the funnel stages being identified we could not learn actionable insights as to how to improve customers acquisition effectively.
Adopt a ‘single source of truth’ framework to evaluate your online acquisition performance
- First, you will need a neutral framework to record all visits to your store (website). It means you will need one SINGLE SOURCE OF TRUTH where every visit coming from any sources on the World Wide Web is collected in ONE single platform so that all data are evaluated EQUALLY.
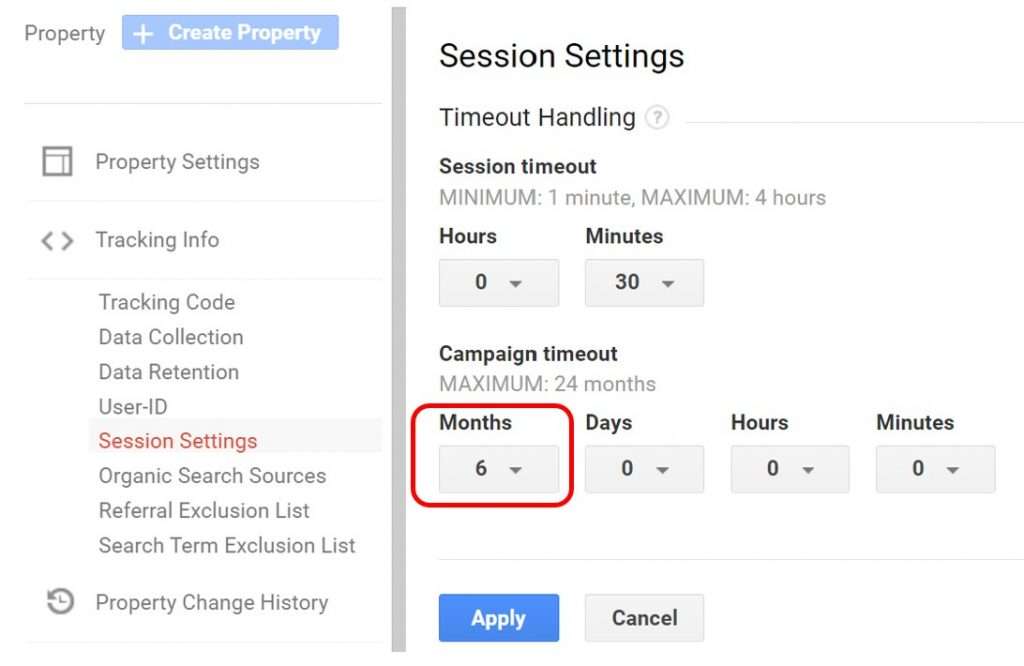
- Secondly, to be able to evaluate touchpoints that ONLY fall within the customer purchase journey (that is, from their very first encounter with your store, to the moment they completed payment), you will have to find out what is the typical time frame of your customer purchase journey.
- Thirdly, to be able to evaluate your customer digital touchpoints by individual level instead of aggregated level, this single source of truth will need to assign a unique identifier for every user that visited the store.
(I) How ‘Users’ are defined by Google Analytics
(II) How are online touchpoints being reported by Google Analytics
- source is the website where the visit came from
- medium is the medium type of the said website source
Now that you know how online touchpoints are reported by Google Analytics, let’s elaborate further with a scenario where you are running an online store that sells face masks, and you presume your customer journey timeframe to be 7 days. One fine day there are 9 online users who have not visited your website before, came across your online store website on Google search organic result, clicked your website link and landed on your website. On the same day, there’s another online user who visits your website directly via www.yourwebsite.com; this particular user is not new to your website, as he/she had visited your website before via the Google search organic result touchpoint 6 days earlier. On Google Analytics it will shows that there are 10 touchpoint sessions reported coming from 10 online users, where the source is ‘google’ and the medium is ‘organic’:

On the surface it may seem as though all 10 touchpoint sessions came from Google search organic results, although there is one session that literally came from direct visit. Once you add a dimension ‘direct session’ next to the source/medium you could then find out there is one session in fact came from direct visit, but due to Google Analytics default ‘non-direct attribution’ rule, it is not reported as the source on the surface.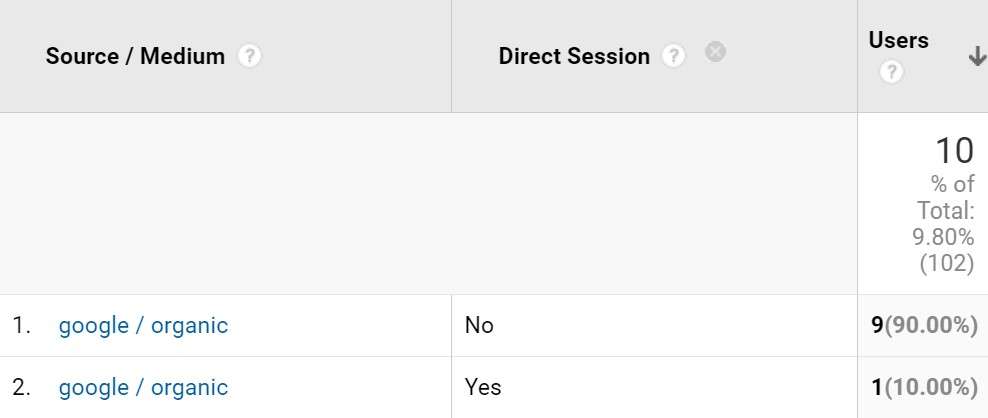
(III) How to find out if the online touchpoints have been fueling your acquisition funnel in stages
- Your customers are able to perform the entire purchase journey within just ONE website domain of yours. In the event where you need to divert users to another website domain to complete the purchase journey, you will have to make sure both websites share the same Google Analytics tracking code, and have implemented cross domain measurement.
- As established earlier that customers acquisition funnel dropping-out happens in a cascading manner instead of in one occurrence, you will want to set up Google Analytics goals according to your acquisition stages. This will not only help you to evaluate which touchpoints have been fueling each individual acquisition stages respectively, it also helps you to be specific on which goal you want to drive in your ads buying tool (Google or Facebook).
- Once you have the Google Analytics goals set up, you will want to make sure all touchpoints that you are investing are clickable via your website URL, so that it will direct user to your website where you have the Google Analytics implemented, and subsequently report which touchpoints had completed the goals that you had set up in the first place.
- The website URLs that you embed for each touchpoints should be unique from one another, whereby the URLs are being tagged with utm codes that represent the touchpoint’s attributes. The utm codes consist of 5 parameters where ‘source’ & ‘medium’ are mandatory to embed, while ‘campaign’, ‘content’ & ‘term’ are optional to embed if marketers want to know more specifics of the touchpoints.
For example, in this coming CNY season you are selling CNY hampers on your website, and you’re planning to attract customers from your existing email database, associate’s newsletter, affiliate website banner, Instagram profile, Facebook post, Facebook catalogue ads, Google shopping ads, Google search ads & Youtube video, Whatsapp message & Telegram message. This is how you may build your touchpoints URL with utm codes.
[table id=1 /]
There are plenty of free tools that could help you generate these UTM links automatically by just inserting each parameter value, for example this Google Analytics UTM builder chrome extension. Note that these parameter names are fixed, we can’t change the parameters to another name because Google Analytics will not register any other parameter names other than these preset ones. But it’s totally up to you on how you want to make use of these parameters because eventually you are the one that will make sense of the attributes you set in the first place. For example, you may not want to monitor the effectiveness of ‘content’, because the ‘campaign’ parameter pretty much sums up the content of the touchpoints. Instead you may want to monitor audience type effectiveness, especially when you think investing in the audience who are ‘similar to whoever that had completed payment on your website before’ could be more cost efficient than the audience without specific targeting criteria. In that case you could fill ‘content’ utm parameter with ‘audience’ attribute instead, and moving forward use that as your reference for audience type.
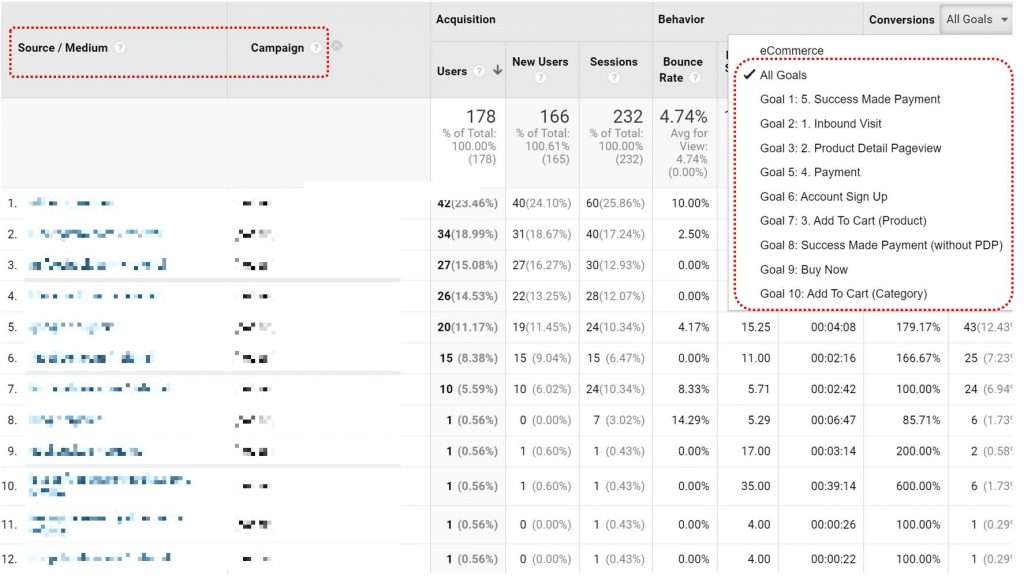
Once online users come through your website via these touchpoints URLs with utm codes, Google Analytics will report all the touchpoints performance according to goals. As you can see from the example screenshot below, each touchpoints’ source, medium and campaign attributes are being reported in rows, and you can even choose individual goals from the right top drop-down to see how each touchpoints perform according to each funnel stages (goals).
If you ever notice there’s ‘Direct’ touchpoint source being reported here, it would be due to either of these three reasons:
- These online users have never clicked through your website via any of your touchpoints at all, he/she just got into your website by typing in your website address on the browser.
- These online users came across your touchpoints before, but it was long before the expected purchase journey that you had set in the first place. For example if you have set the time frame to 30 days, the user came to your website via your Facebook ads on day 1, but never came back again until on day 31 he/she came back for the second time via your website address directly.
- Because there are certain touchpoints not being tagged with utm codes properly, or not being tagged at all. I’ve attached a video below as one of the examples when the email touchpoint is not being tagged with utm codes, end up reported as ‘Direct’ source on Google Analytics.
Use this point of reference to control your acquisition cost
One way to optimize your acquisition cost efficiently is by automating the ROAS (return on advertising spend) rule if it’s available on the touchpoint channels you are investing. Currently, the digital duopoly Google & Facebook are equipped with this ad buying automation where you can command Google or Facebook ads to generate the returns ratio that you want to achieve against the ads spend. In order for Google ads & Facebook ads to automate the returns ratio that you would expect, you will first need to ensure both Google ads & Facebook ads have the information about your transaction value. That means, every time when the ads generate sales, your website is able to send the transaction amount back to Google & Facebook ad buying tool to reverse-engineer the return & ads spend ratio. You can send transaction value back to Google Ads by setting up transaction-specific conversion tracking on your website, whereby you will need to work with your web developer to push transaction value dynamically. Whereas for Facebook ads, you can send back transaction value by setting up Facebook pixel with ‘purchase’ event tracking on your website, also you will have to work with your web developer to pass the transaction value to the pixel dynamically.
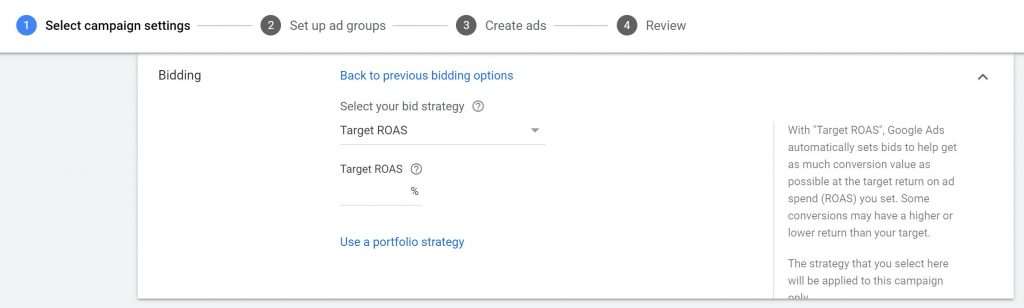
This is where you can set target ROAS on Google ads
And this is where you can set minimum ROAS on Facebook ads
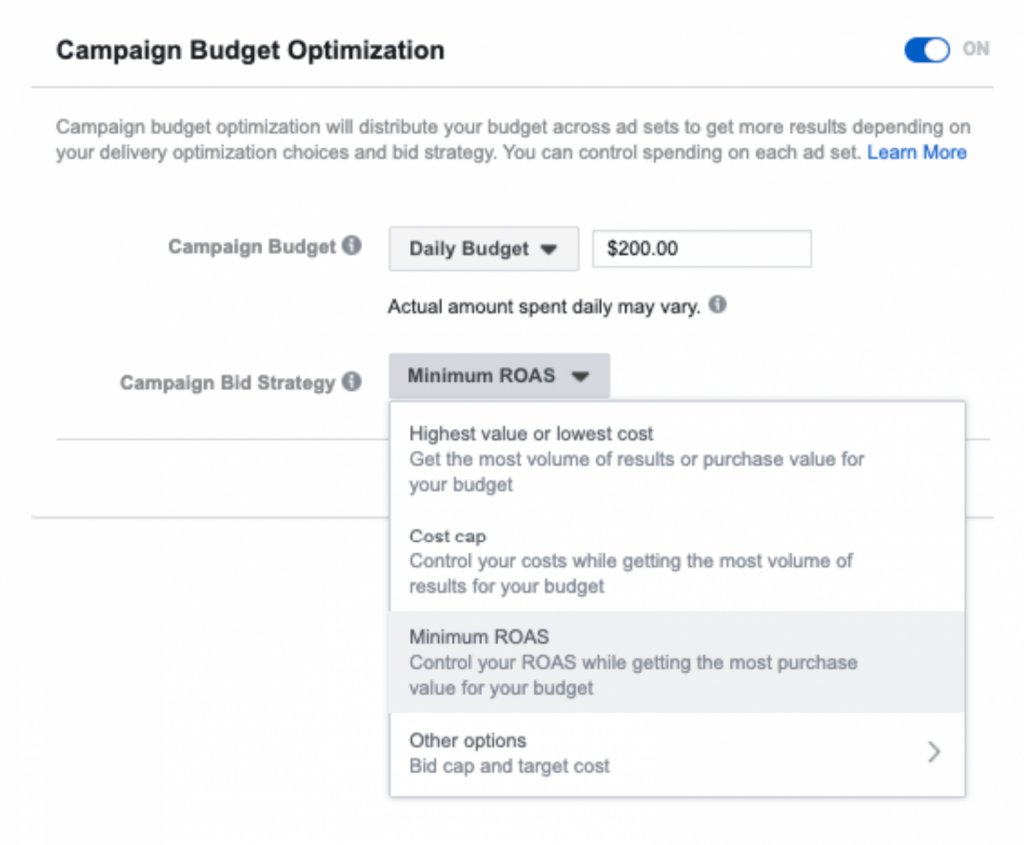
For example, you want to generate 300% returns from your ad spend. In Google ads you could key in 300% in the ‘target ROAS’ field; while in Facebook ads you could key in $3 in the ‘minimum ROAS’ field, that’s telling Facebook for every $1 ad spend you want to expect a minimum of $3 sales. However, take note that this ROAS automation does not factor in the CPA value that you want to achieve. This rule is only telling the algorithm to focus on generating the returns ratio while your target CPA will be ignored.
| Channel A | Channel B | Channel C | |
| Budget allocated | $1,000.00 | $1,000.00 | $1,000.00 |
| Average Cost Per Click | $0.50 | $0.50 | $0.50 |
| Total clicks | 2000 | 2000 | 2000 |
| Total conversions | 30 | 20 | 10 |
| Conversion rate | 1.50% | 1.00% | 0.50% |
| Cost Per Acquisition | $33.33 | $50.00 | $100.00 |
As you can see, even though the budget and CPC pricing are the same across all A, B & C channels, but with different conversion rate performance, you will realize actually you are spending more cost to acquire a customer acquisition on channels that perform at lower conversion rates. When it comes to scrutinizing the conversion rate performance according to the channel you could then refer to your touchpoint attributes and learn what are the winning factors. For example, it could be because channel A is a touchpoint where the ads are being shown to the right audience (audience attribute), with a prominent ads space (medium attribute).
